Project Overview
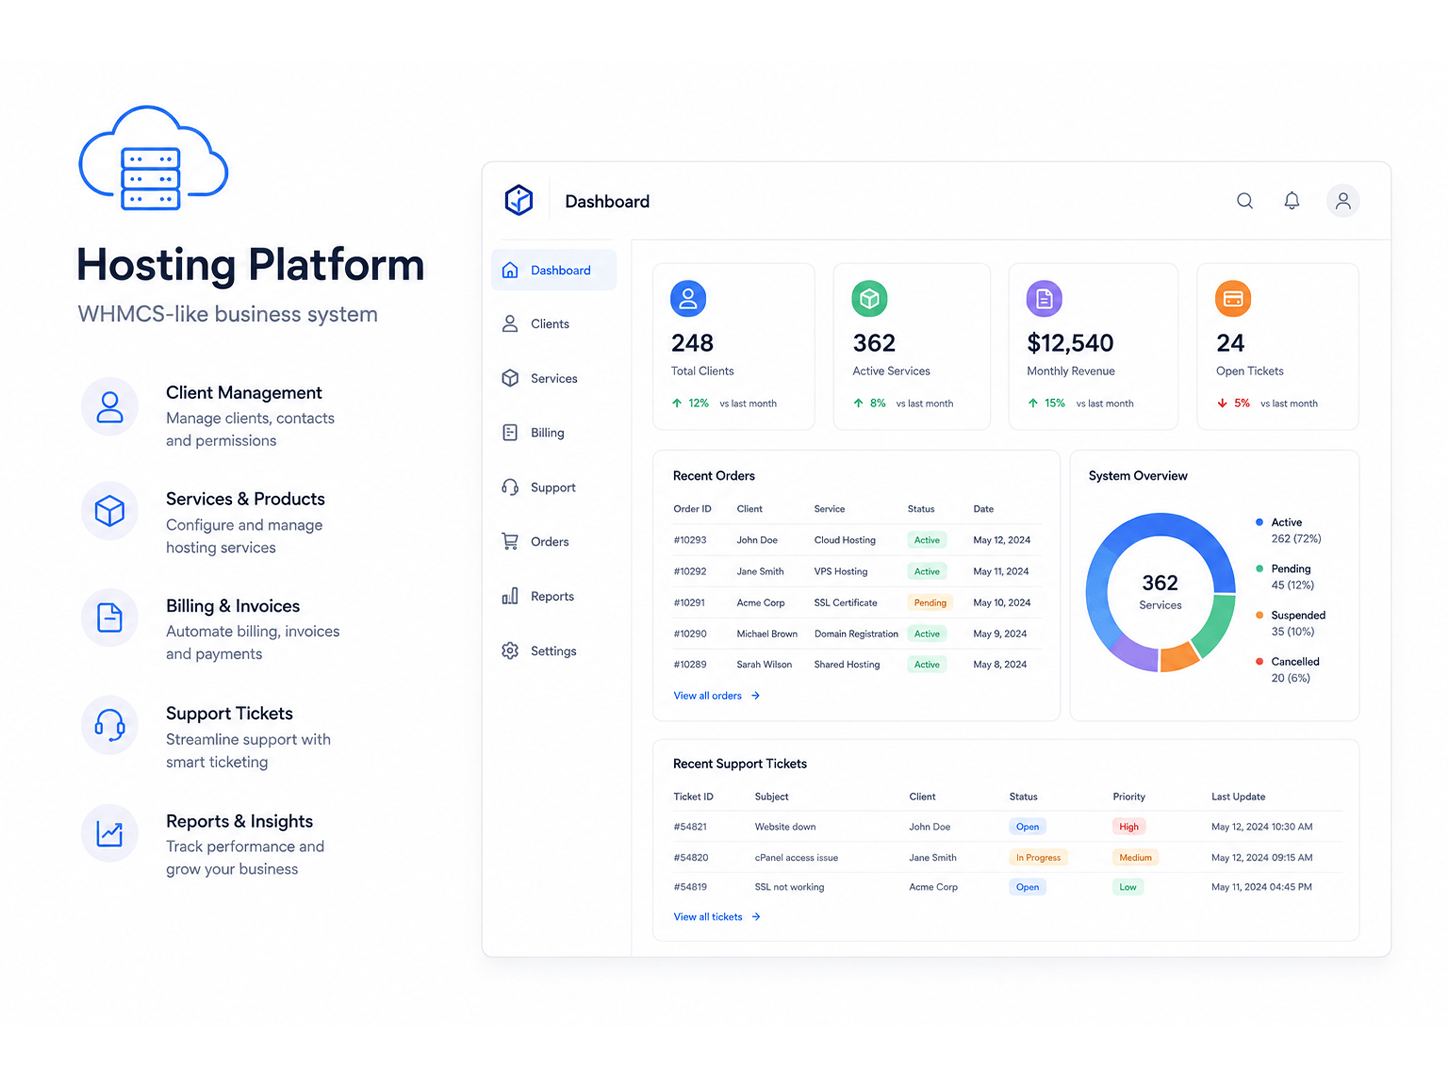
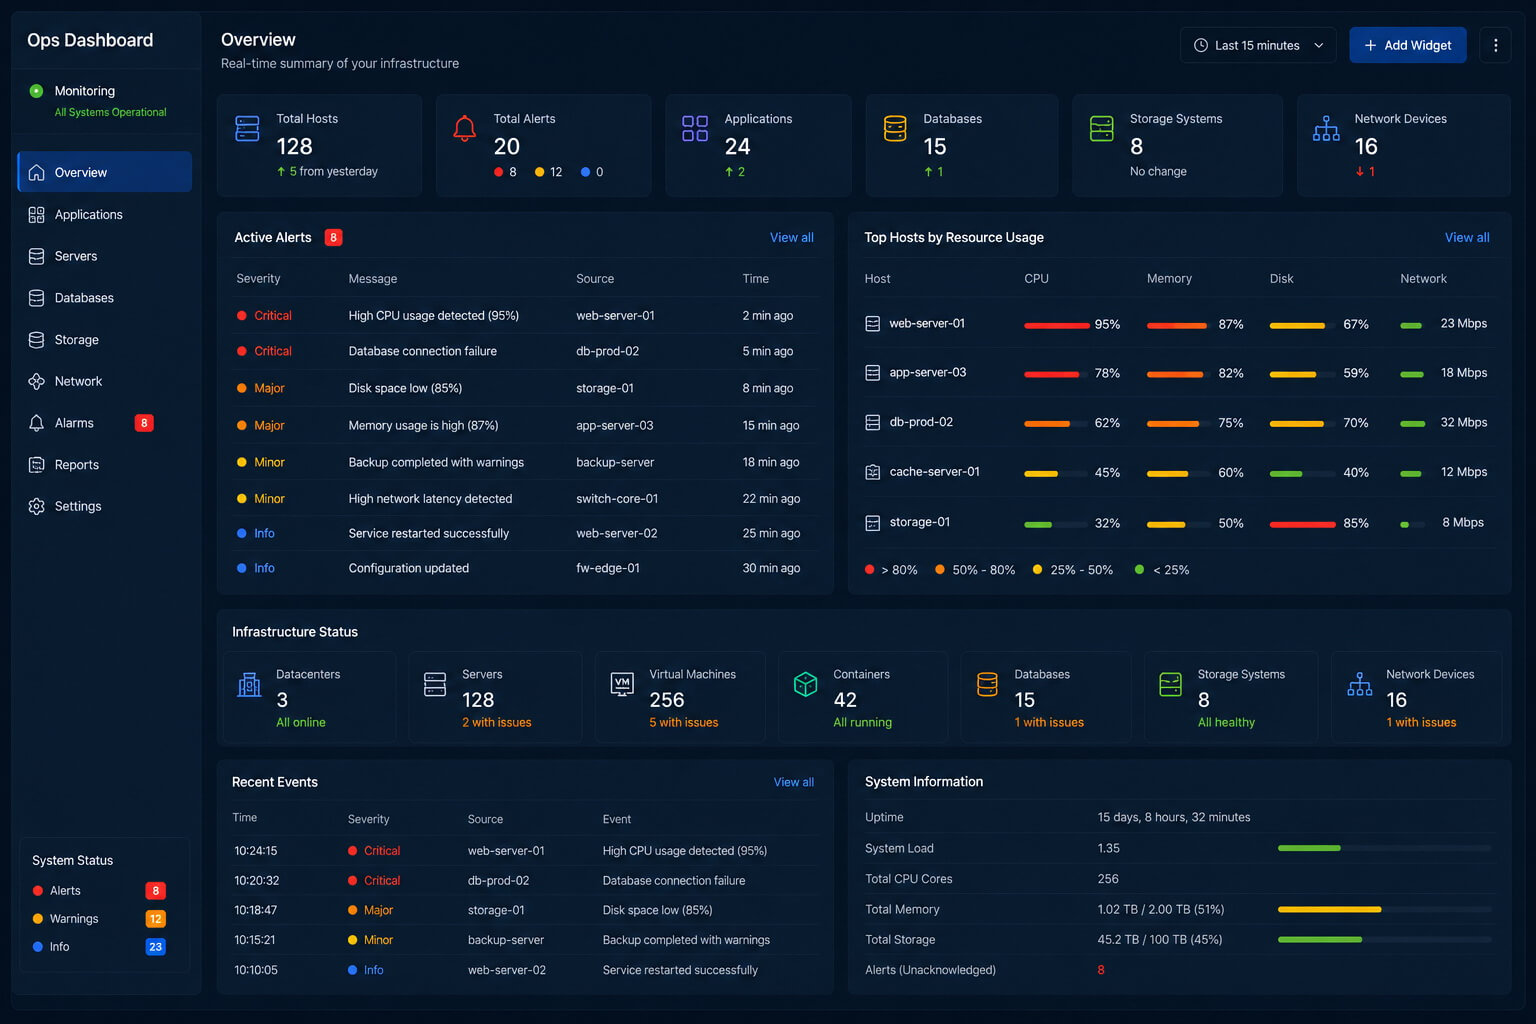
A managed hosting provider needed a centralized operations dashboard to improve visibility across daily business processes, infrastructure services, and customer-facing operations. Teams relied on multiple tools to monitor performance, track service status, and review operational metrics, creating inefficiencies and limiting real-time decision-making.
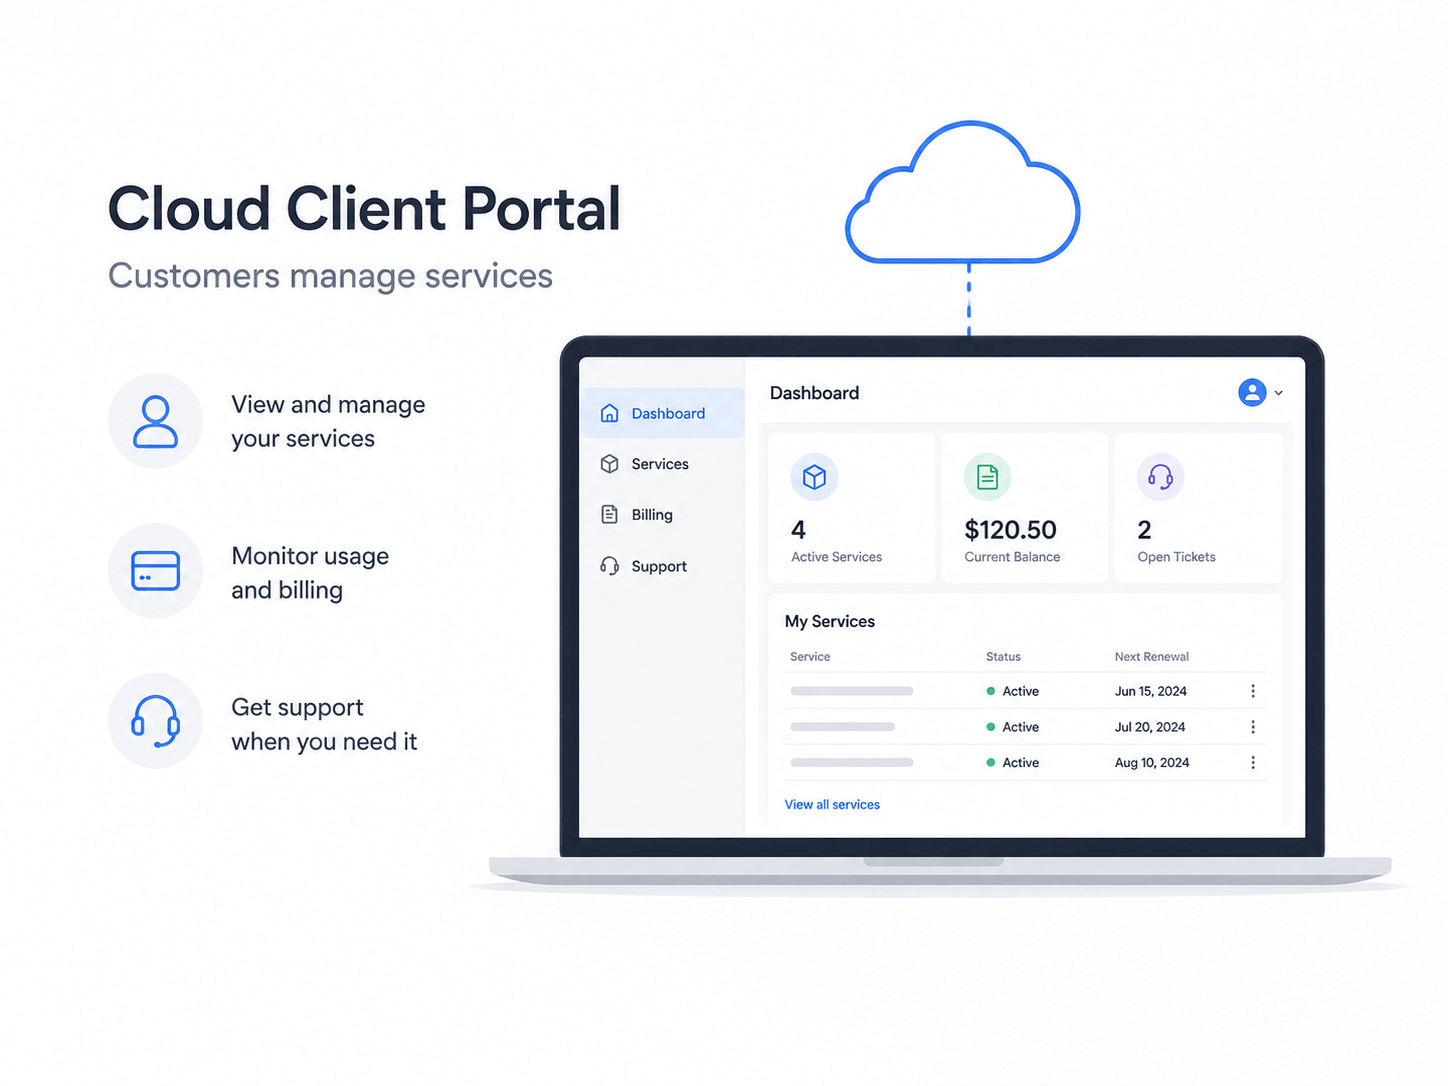
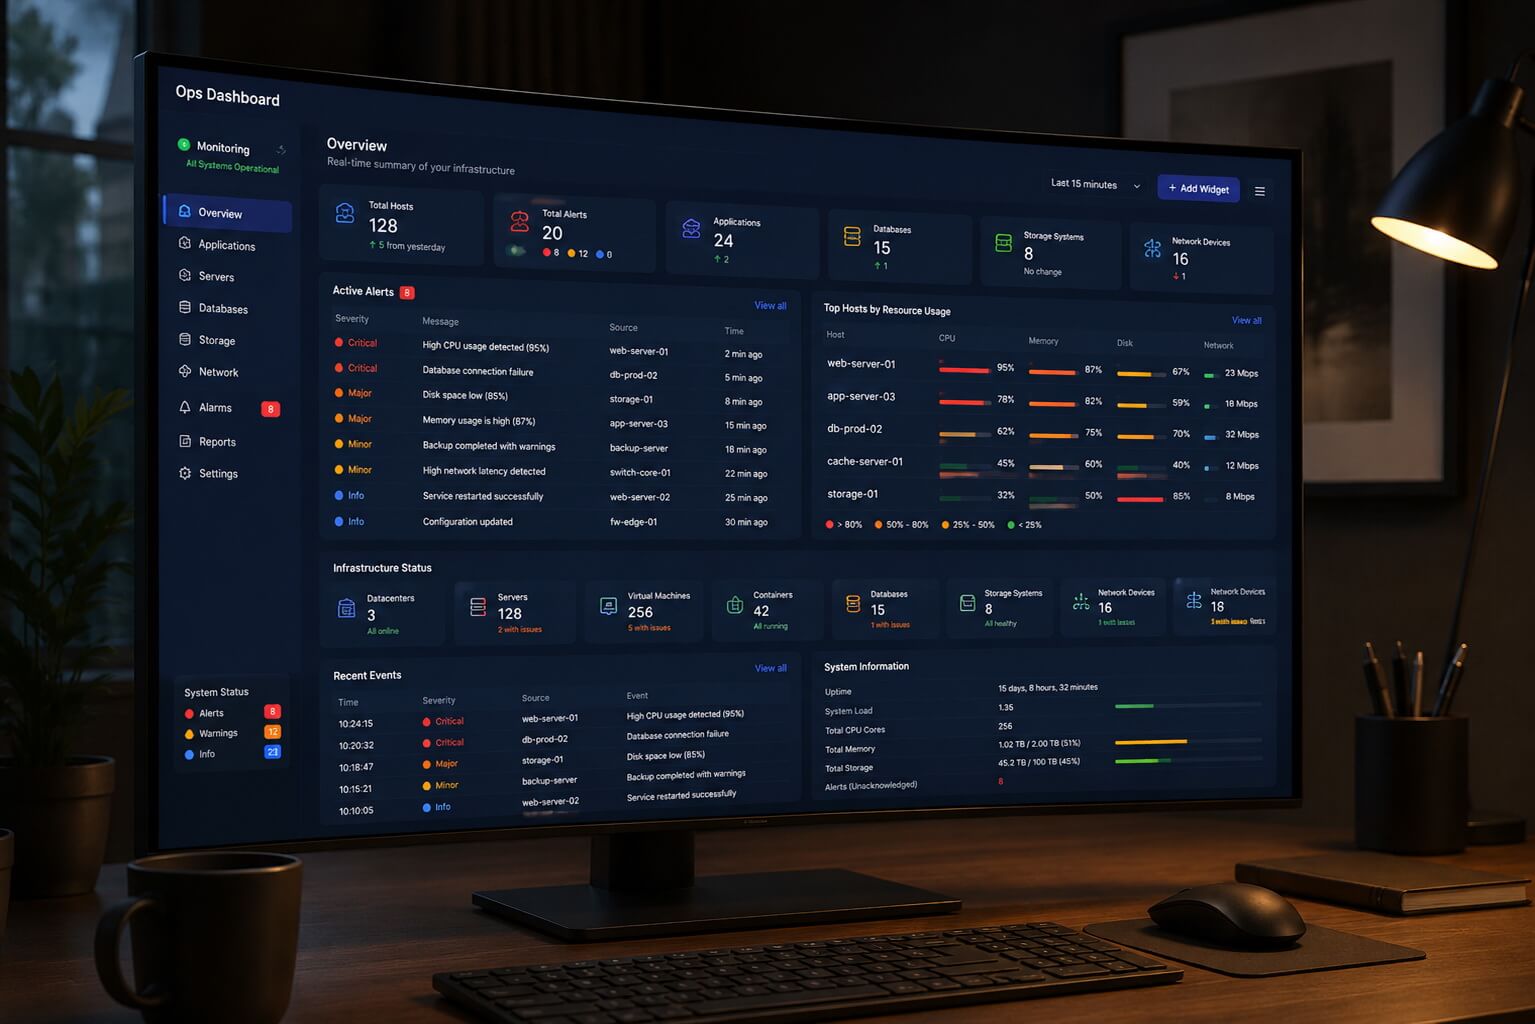
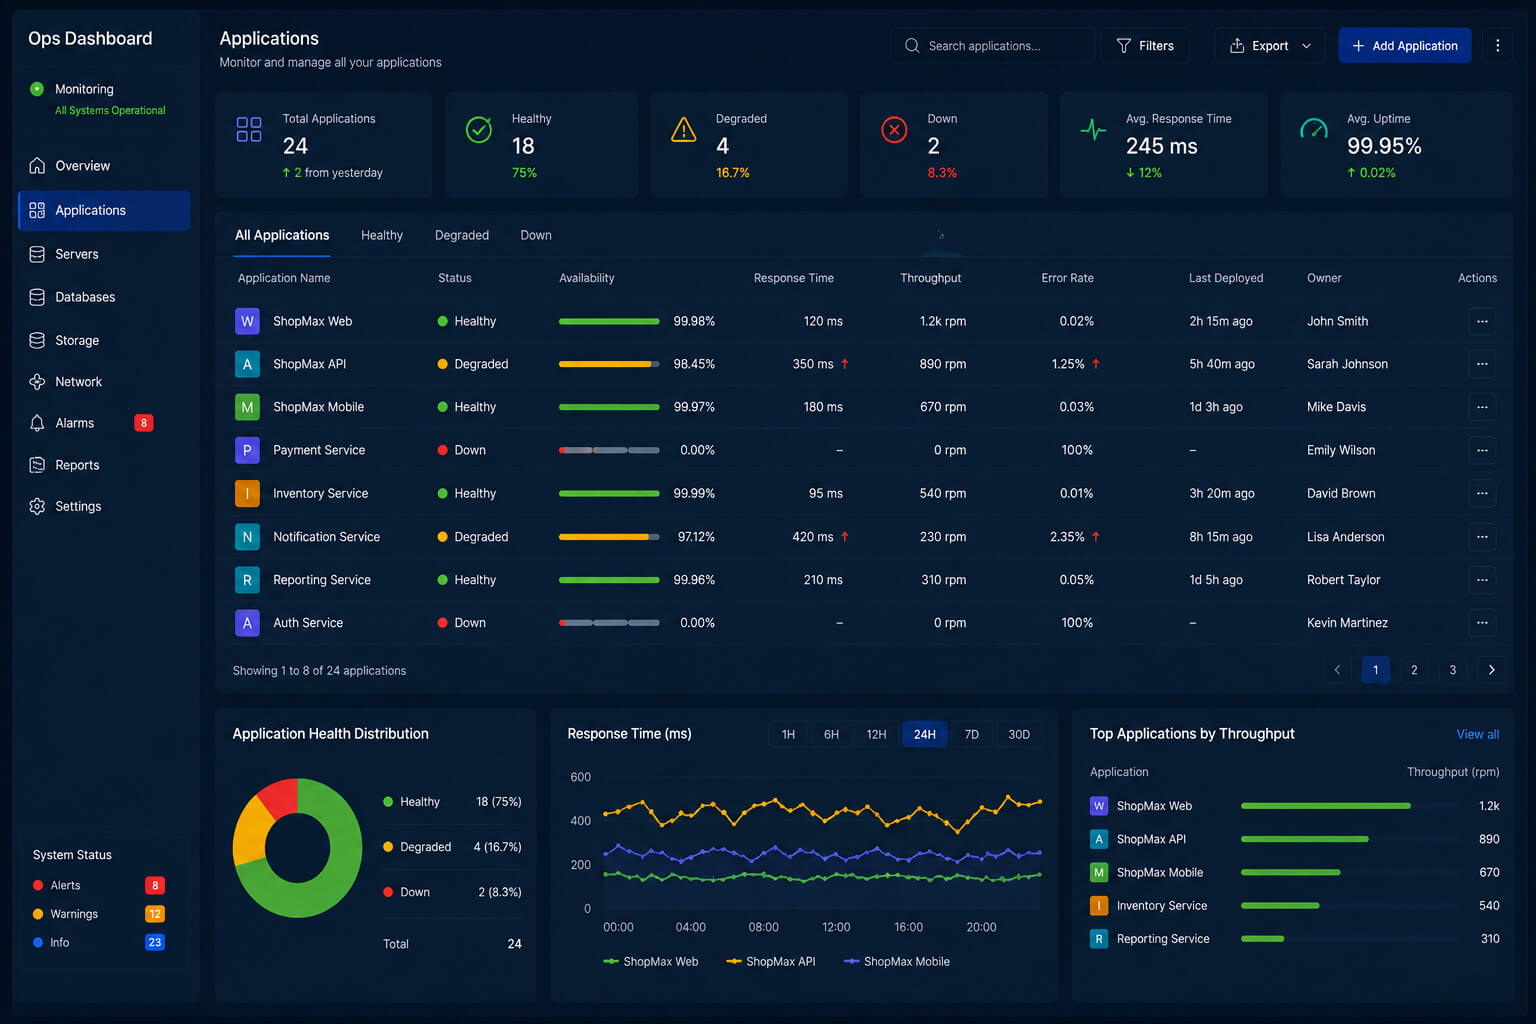
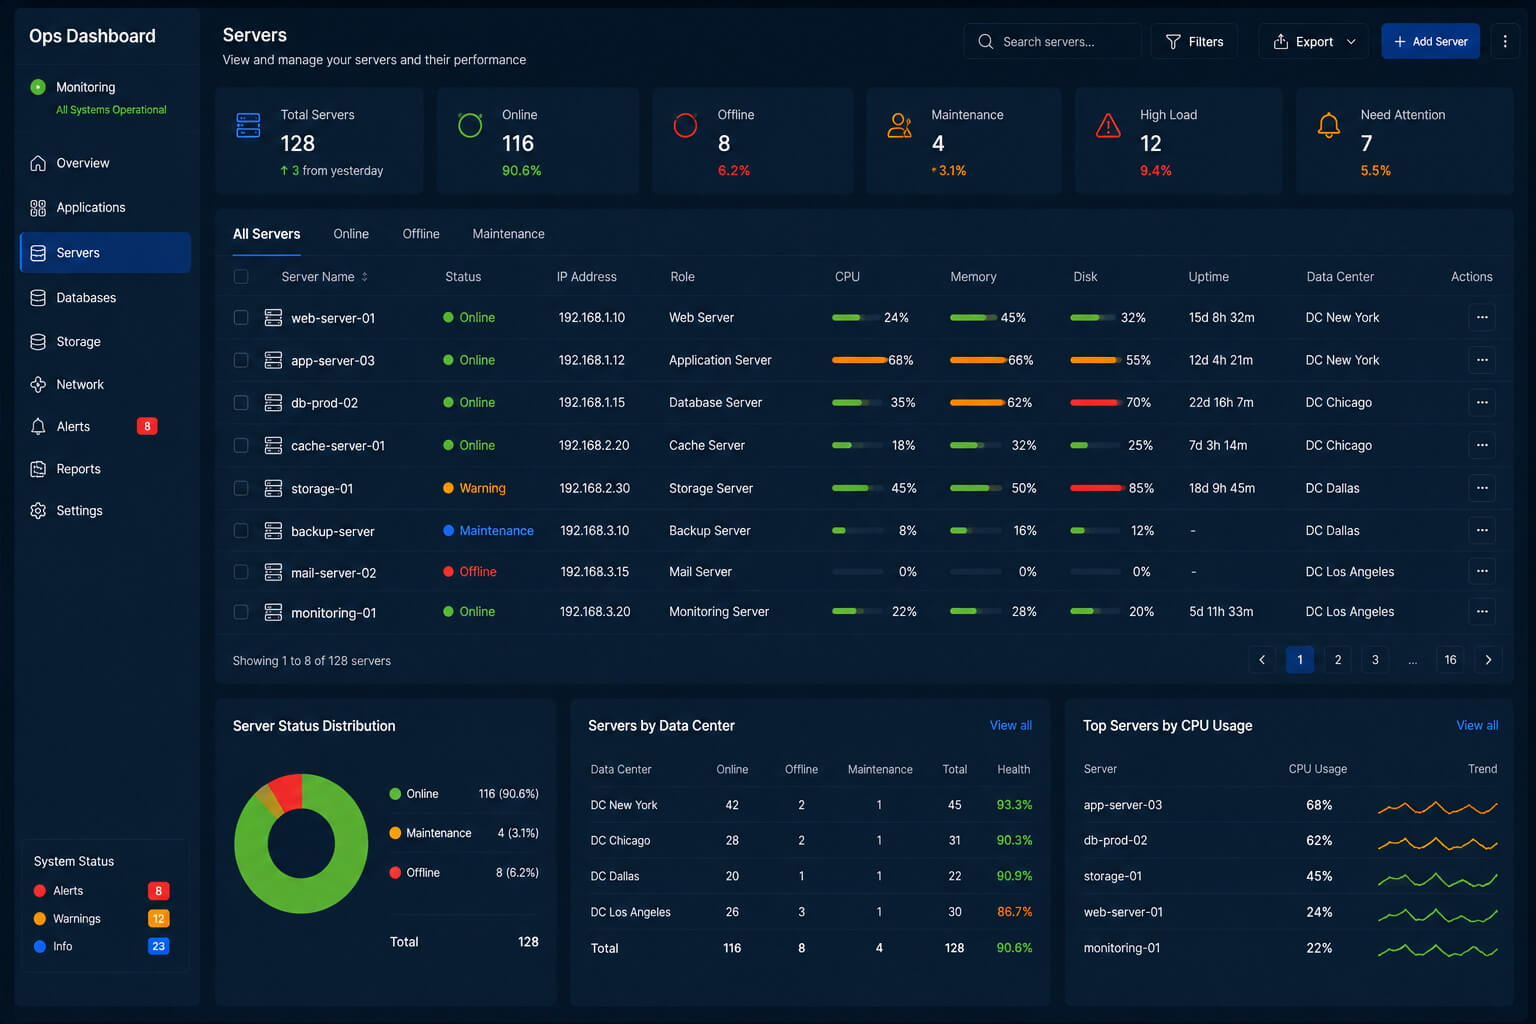
We deployed and customized our operations dashboard to match the customer's operational workflows and reporting requirements. The platform consolidates key operational data into a single interface, providing real-time insights into infrastructure performance, service health, support activity, and business operations through configurable dashboards and reports.
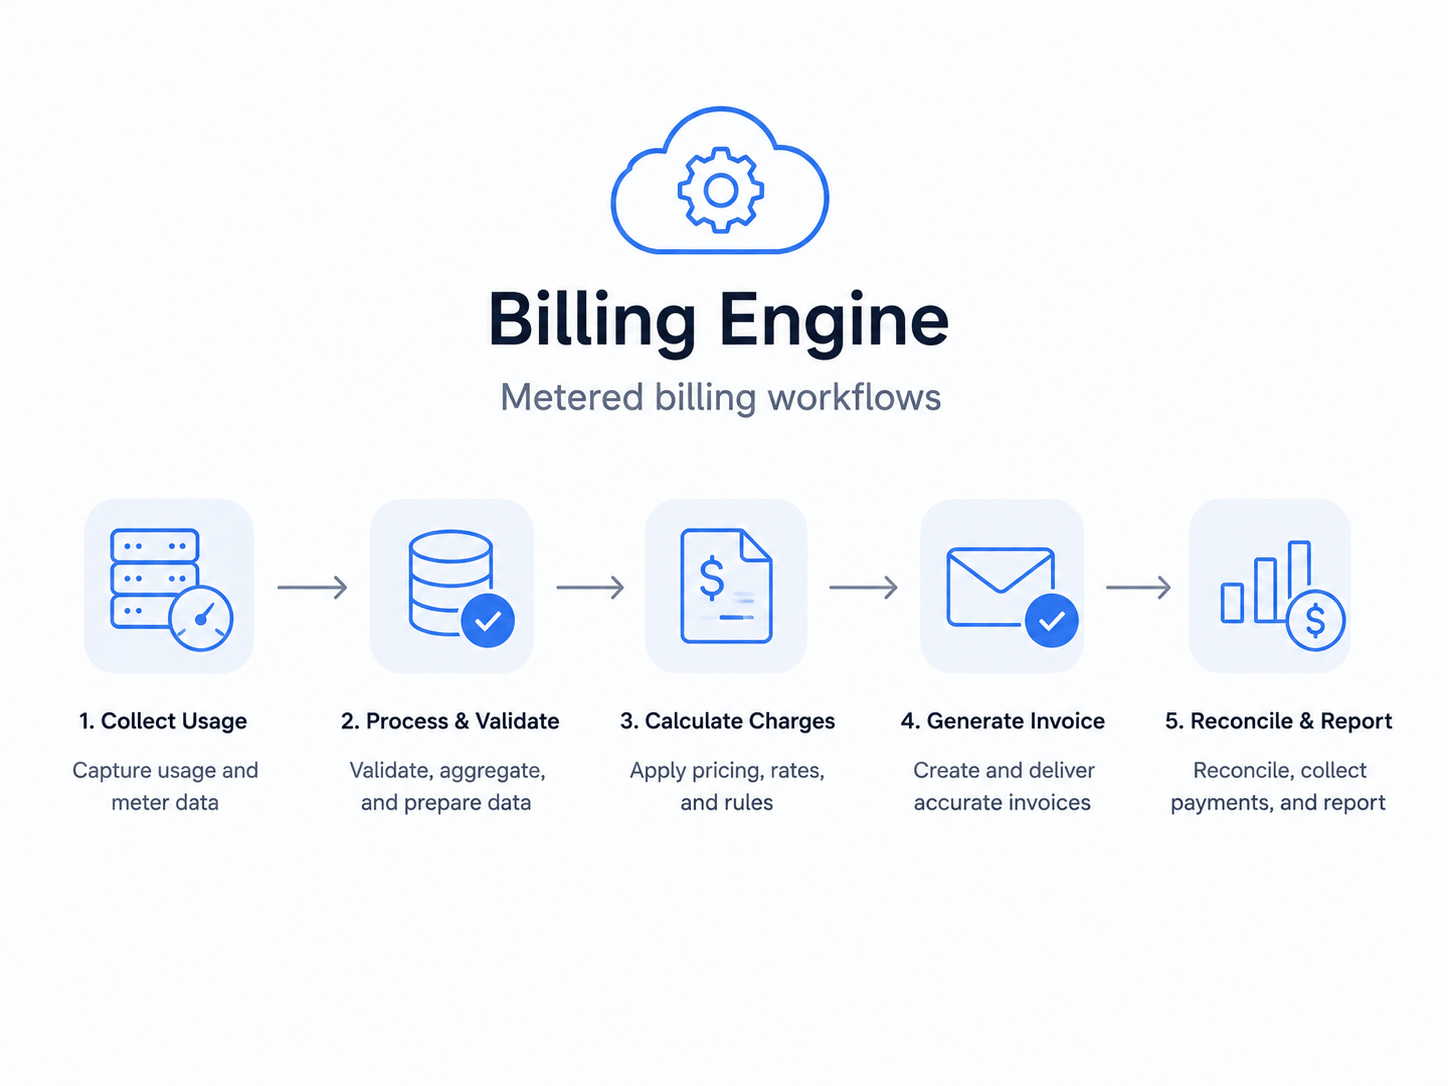
Our solution integrates with monitoring systems, support platforms, billing software, and infrastructure services, giving operations teams a unified view of critical metrics and workflows. The result was improved operational efficiency, faster access to information, and better-informed decision-making across the organization.
The Challenge
- Operational data was spread across multiple systems and dashboards
- Limited real-time visibility into key business and infrastructure metrics
- Manual reporting and data collection processes
- Slow access to operational insights for management teams
- Difficulty tracking performance across support, infrastructure and business operations
Our Solution
- Centralized operations dashboard for all critical business metrics
- Real-time monitoring of services, support activity and operational performance
- Automated reporting and data aggregation
- Custom KPI dashboards for different teams and departments
- Unified visibility across infrastructure and business operations
- Integration with monitoring, billing and support platforms
Implementation Results
50+
Operational KPIs Tracked
75%
Faster Decision-Making
65%
Reduced Manual Reporting
98%
Dashboard Adoption Rate
Key Features
Unified KPI Dashboard
Track business, operational and infrastructure metrics through customizable real-time dashboards.
Automated Reporting
Generate operational reports automatically and provide stakeholders with up-to-date performance insights.
Performance Analytics
Analyze trends, service performance, support activity and operational efficiency across departments.
Executive Overview Panel
Provide management teams with a centralized view of critical KPIs, alerts and business performance indicators.
Advanced Data Search
Quickly find operational data, metrics, reports and historical records through a centralized search interface.
Operational Alerts & Notifications
Receive real-time notifications for important events, KPI thresholds, service issues and operational anomalies.
Project Timeline
Discovery & Requirements Gathering
Week 1-2Business requirements analysis, KPI definition, stakeholder interviews and operational workflow assessment.
Dashboard Adjustment & Planning
Week 3-4Information architecture, dashboard wireframes, reporting structure design and user experience planning.
Core Dashboard Setup
Week 5-8Development of KPI dashboards, reporting modules, analytics views and operational data visualizations.
Data Integrations & Automation
Week 8-11Integration with billing systems, support platforms, monitoring tools and internal business applications.
Testing & Deployment
Week 12-14Data validation, performance testing, user acceptance testing, deployment and operational onboarding.
"Holybit's operations dashboard gave our teams a single source of truth for operational and business performance. Real-time visibility into key metrics, centralized data, and automated reporting significantly improved decision-making and operational efficiency across the organization."
Operations Director
Managed Hosting Provider
Project Info
Client
Managed Hosting Provider
Category
Operations Dashboard
Date
July 2026
Duration
14 Weeks
Team Size
5 Engineers
Industry
Hosting & Cloud Services
Technologies

React

TypeScript

Node.js

PostgreSQL

Prometheus

Grafana